So another month past by so fast and the holiday season is approaching in big steps, and we, in Germany, specific Munich that is, have the 1st Advent weekend with the first round of Christkindel markets and Glühwein. ;-) Four more weeks and als those Black Friday presents can be unwrapped.
Anyway, to my topic. Since I've left my project I had a little extra time at hand, so I thought, I experiment with some agile domain driven techniques I've heard over the past year, but I had never time to dig into them, nor had the opportunity to learn about them.
These techniques are: Event Storming (ES), Domain Story Telling (ST), Concept Maps (CM) and Simple System Description (SSD)
Simple System Description
Let's start with the last one, the Simple System Description (SSD). It is a technique, which mankind uses since ages. It is nothing new, nothing fancy, nothing with graphics, just plain simple sentences. That what you do if you explain something to someone, who does not have a deeper understanding of a subject.
Maybe an example is best to explain it. Let's assume you would want to explain the color red to someone. You might be refering to the Wiki article, which starts with:
... Red is the color at the long wavelength end of the visible spectrum of light, next to orange and opposite violet. It has a dominant wavelength of approximately 625–740 nanometres.[1] It is a primary color in the RGB color model and a secondary color (made from magenta and yellow) in the CMYK color model, and is the complementary color of cyan ...
Most likely if you are not familiar with wavelengths or spectrum of light, you might easily get lost in a sea of words and concepts you have no idea of. Here is where the SSD technique steps in.
Plain simple sentences:
Red is a color
Red is a primary color in the RGB color model
The RGB color model is made of Red, Green and Blue
Red is a secondary color in the CMYK color model
The CMYK color model is made of Cyan, Magenta, Yellow and Key
Key is usual the color black
Red is located at the end of the visible spectrum of light
aso ...
So SSD is just a basic method to break up information in easy bite sized junks of information, which are easy to digest.
An example
Since I worked with a ticketing system (Jira) for the last two years, which had an locked in workflow, due to the enterprise setup we had to use, I made my own (quick and simple) workflow description in SSD, to test out this and other techniques.
So here it is, my SSD of a ticketing system. Not complete, not optimized, just some simple sentences hacked in an editor within 15 minutes, to describe the ticketing domain. For a real project, you would need even more description.
...
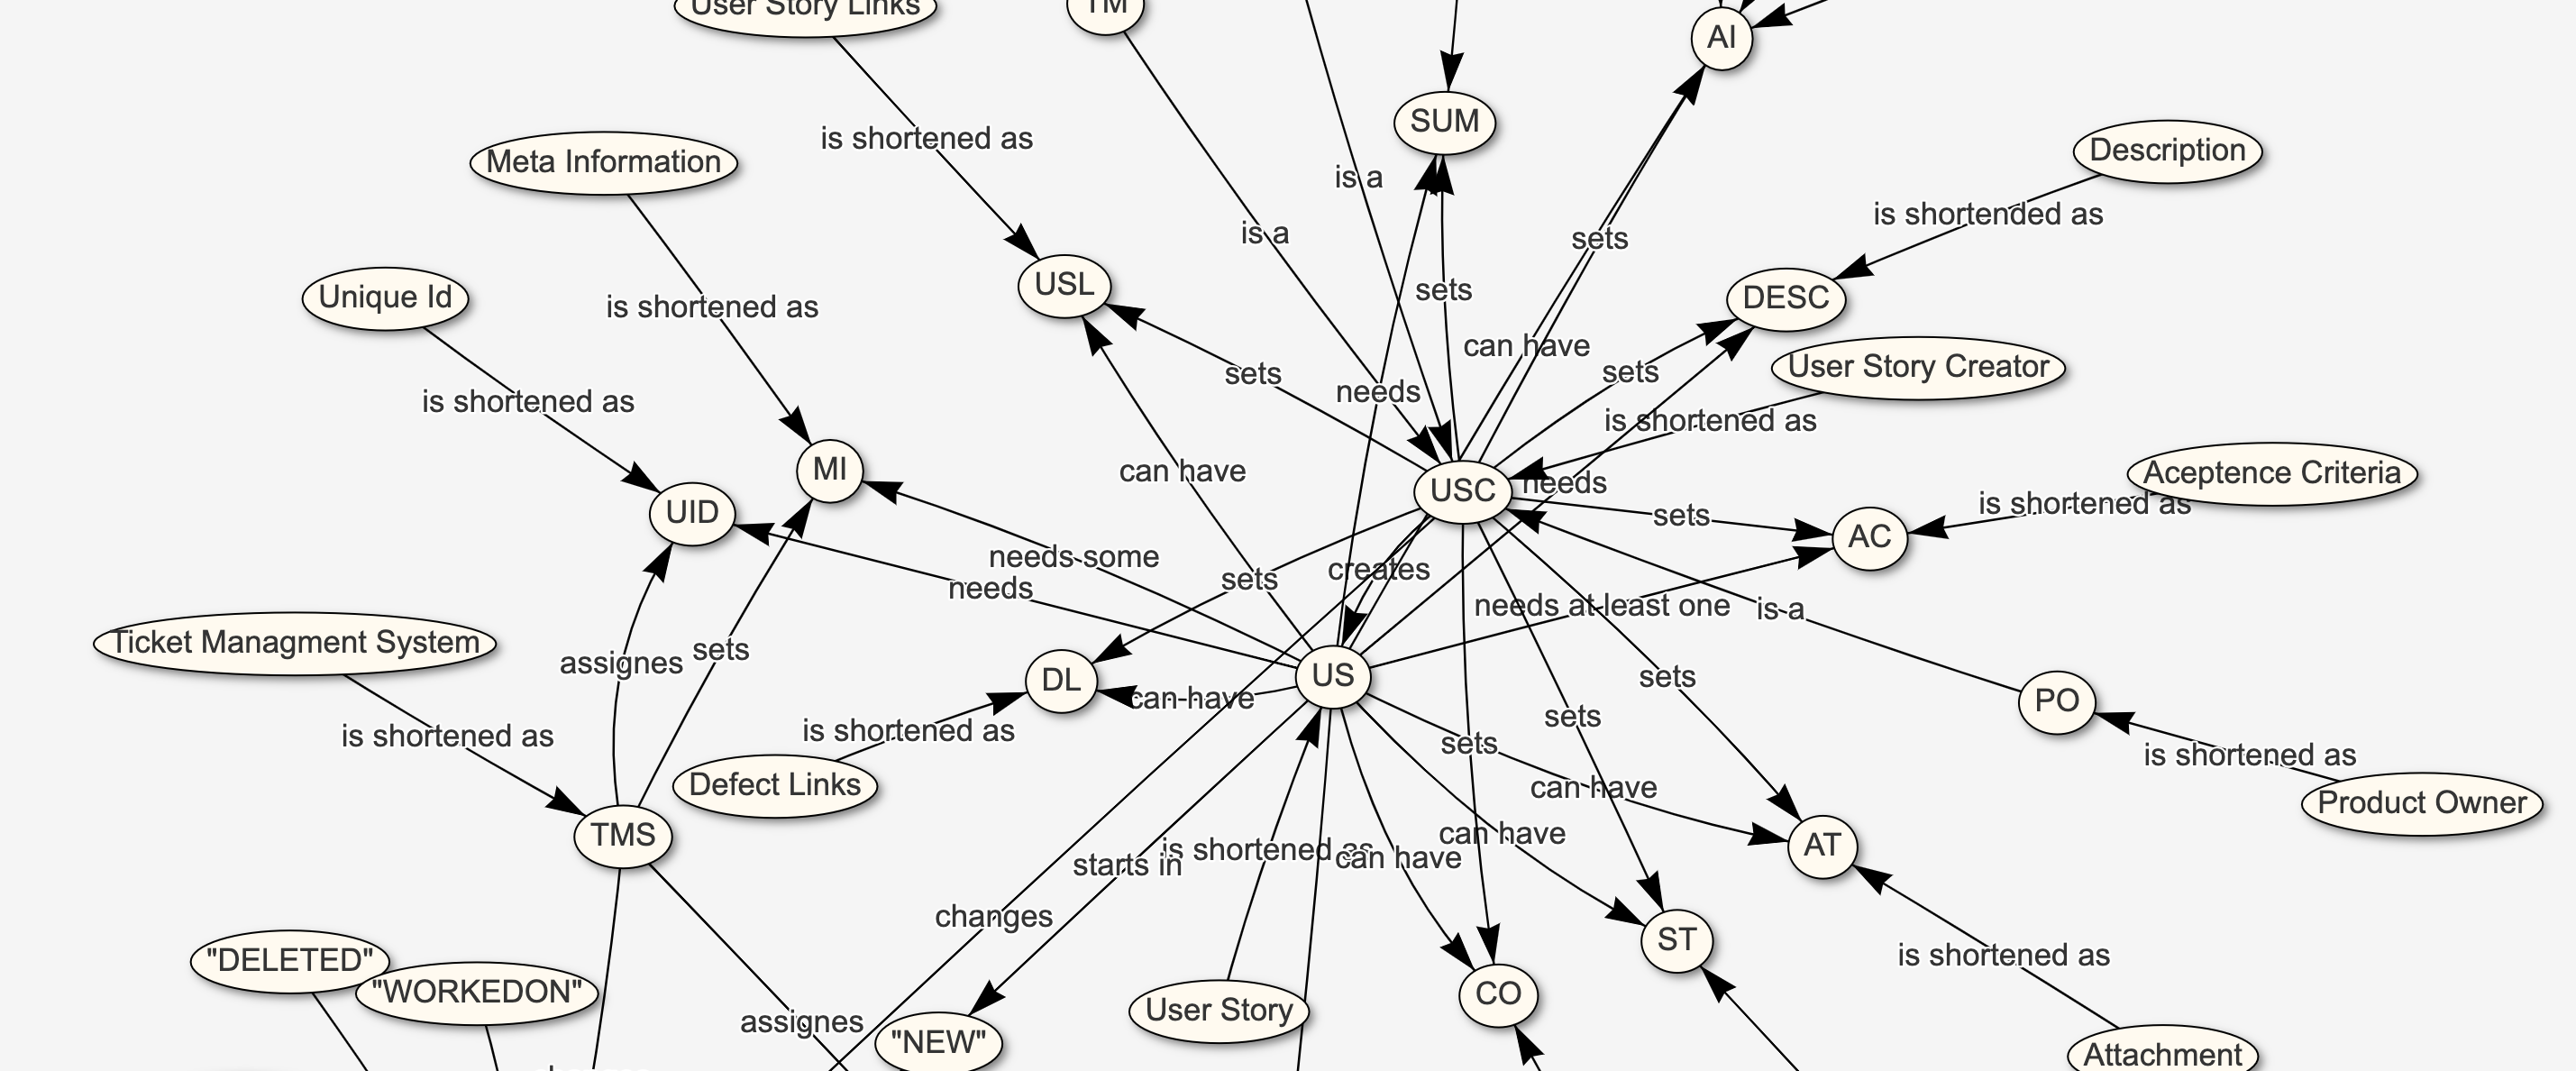
A User Story Creator (USC) create the User Story's (US)
A Product Owner (PO) can be a USC
A Team Member (TM) can be a USC
A Stakeholder (SH) can be a USC
A US needs a short summary (SUM)
A US needs a description (DESC)
A US needs at least one acceptance criteria (AC)
A US needs a unique id (UID)
A US need some necessary meta informations (MI)
A US need some necessary organizational informations (OI)
A US can have links to other US's (USL)
A US can have links to other Defects (DL)
A US can have sub-tasks (ST)
A US can have one or more attachments (AT)
A US can have none or many comments (CO)
A US can have optional additional informations (AI)
Status is an OI
Estimation is an OI
Assignee is an OI
Creator is an OI
Project is an OI
Project ID (PID) is an OI
Ticketing Management System (TMS) assignees UID
TMS assigns PID
TMS sets MI
USC sets OI, SUM, DSC, AC, USL, DL, ST, AT, CO, AI
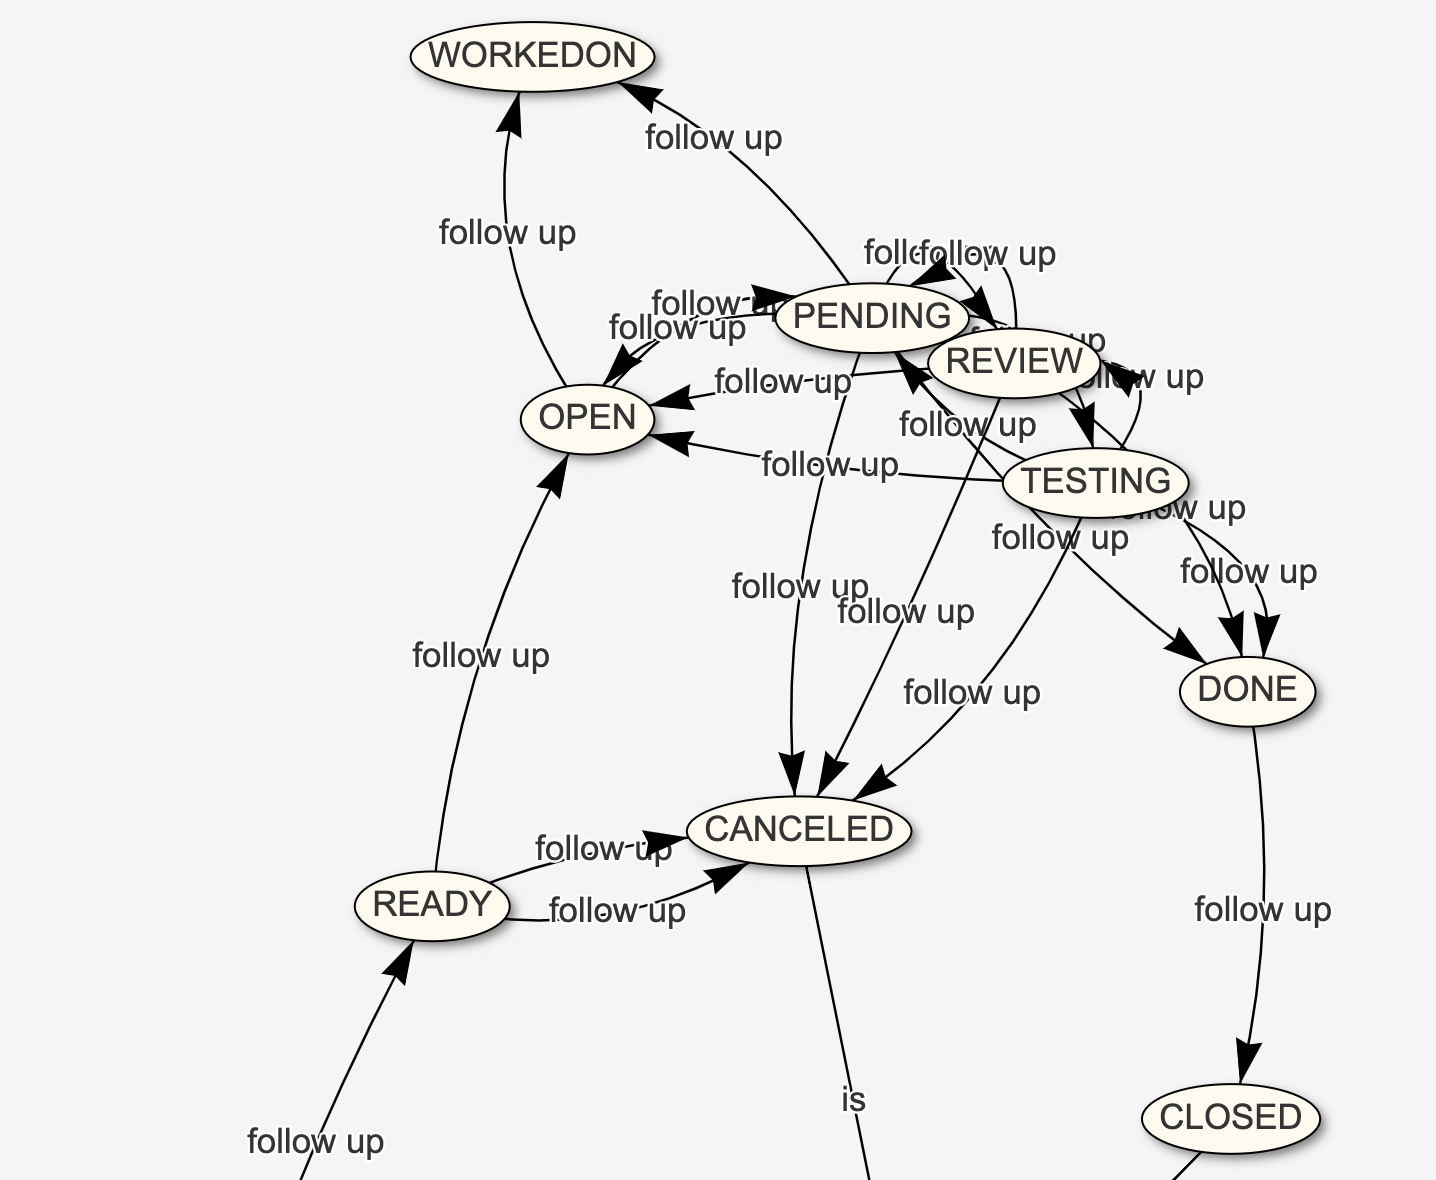
A US starts with status "New"
A US in "NEW" has the following follow up statis: "DELETED", "SPECIFICATION"
A US in "DELETED" is locked forever
A US in "SPECIFICATION" has the following follow up statis: "ESTIMATE", "DENIED", "REWORK"
A US in "ESTIMATE" has the following follow up statis: "READY", "REWORK"
A US in "DENIED" is locked forever
A US in "REWORK" has the following follow up statis: "SPECIFICATION", "DELETED"
A US in "READY" has the following follow up statis: "OPEN", "CANCELED"
A US in "CANCELED" is locked forever
A US in "OPEN" has the following follow up statis: "WORKEDON", "PENDING"
A US in "WORKEDON" has the following follow up statis: "PENDING", "TESTING", "REVIEW", "CANCELED"
A US in "PENDING" has the following follow up statis: "OPEN", "WORKEDON", "TESTING", "REVIEW", "CANCELED", "DONE"
A US in "TESTING" has the following follow up statis: "OPEN", "REVIEW", "PENDING", "CANCELED", "DONE"
A US in "REVIEW" has the following follow up statis: "OPEN", "PENDING", "DONE", "CANCELED"
A US in "DONE" has the following follow up statis: "CLOSED"
A US in "CLOSED" is locked forever
Statis can be changed by USC, TMS
...
Well, if you took your time and read through all of it you should have a basic understanding of my ticketing system. At least you should have figured out some things about it. Eg. there is a somewhat complex status workflow. The tickets can have different kind of informations and there are some players acting with the ticket. And as a Software Developer/Software Architect you should have all what you need for starting the first draft of a Domain Model, which you can use, to build a ticketing system on it.
Event Storming
I head of Event Storming during 2020 when Youtube suggested my this video from the "goto"-Conference from 2018.
The presenter, Alberto Brandolini (https://www.eventstorming.com/), made a good point in his description of his method. So naturally I wanted to learn about it and try it out, but it took me till end of 2022 to have time for it. So I watched a bunch of videos about Event Storming, believe me there are some good ones on YouTube, read some articles how the method works, the ideas behind it and some tips and tricks. Of course I didn't bought the book, cause my company did not want to pay for it and I need my money currently for heating and power :-(
After reading and watching enough, I started Event Storming. Not in an ideal setup, since it was only me. Normally you should have a facilitator and a bunch of people which are working in the specific domain, you want to explore. Also the method suggest, you should use a huge wall with paper and an assortment of colorful post its. Don't have that. No long wall, no roll of paper, no colorful post its. So a software tool was in need. And draw.io came to rescue.
Anyways heres my story about Event Storming.
First I made a template for the different colorful post its.
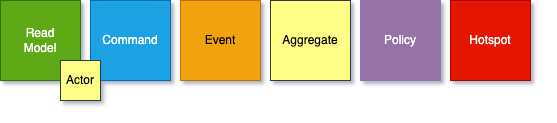
Was not so complicated, and then I started adding Domain Events, after Domain Events in draw.io, based off the SSD from above. After a while I had a lot of Domain Events. So I started ordering them after the time of occurense. After that I added the Commands which I thought go in front of Domain Events. Then going over each tuple, I added Aggregates, Read Models and Behaviors. And in the end I had a nice picture. Well, and it seems like a proper Event Storming board. But I'm sure I made a bunch of errors and applied some wrong rules. But as I wrote it was my first try.
Here is the result.
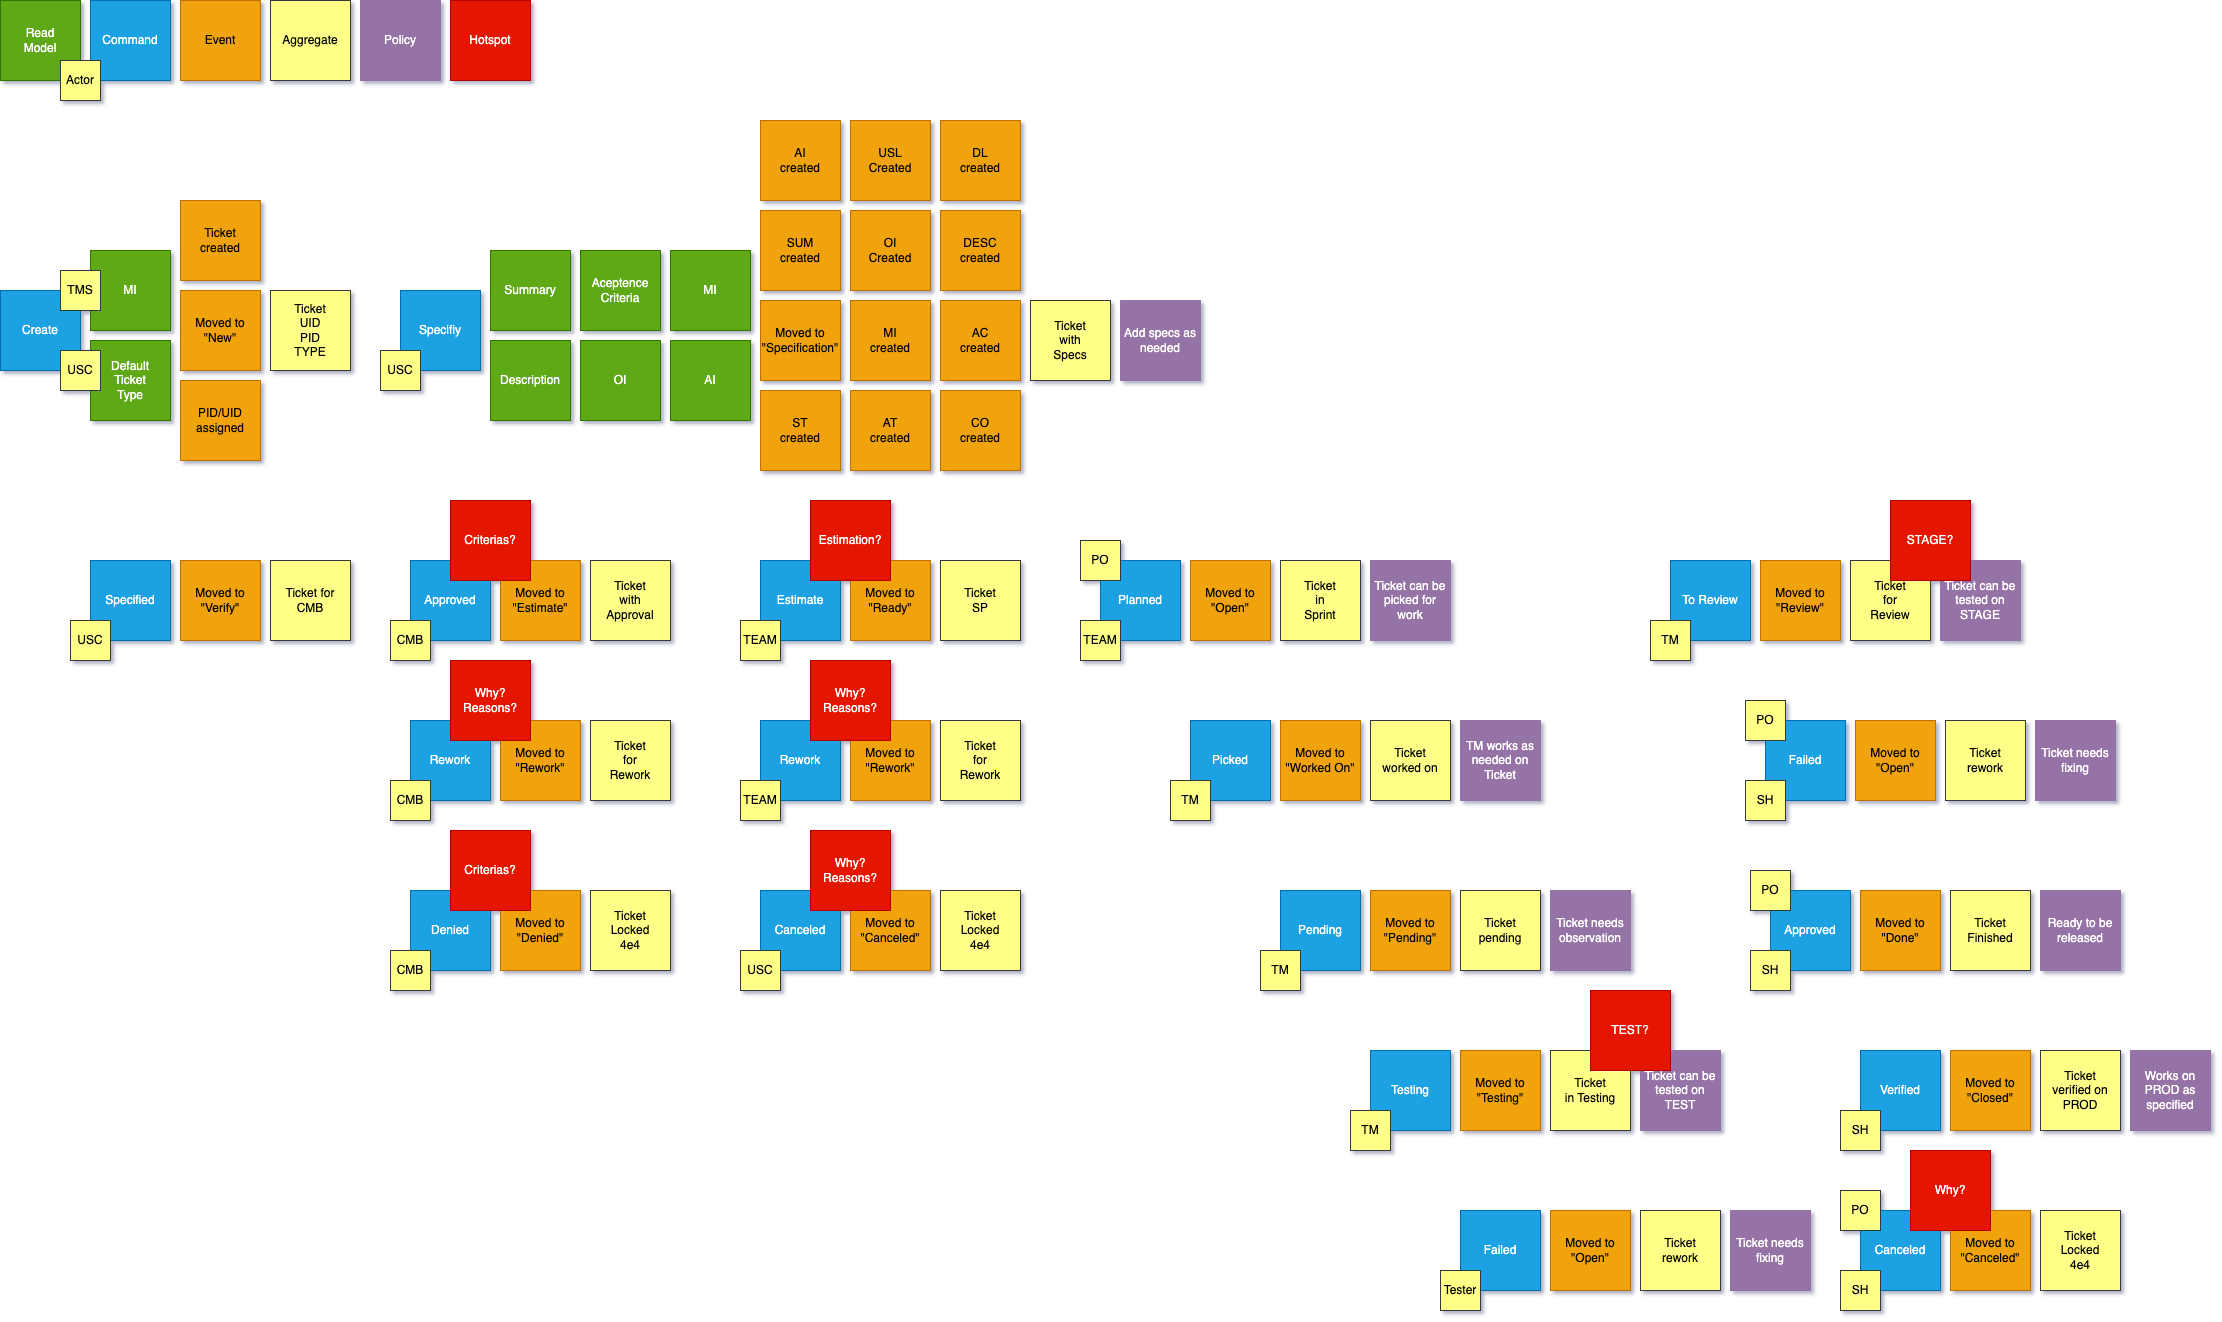
Hmm, when you look at it, you see it is very colorful. And you kinda see how the story moves trough it. There are roles and data, and also hotspots, where more information is needed. So all in all it gives you a good understanding about the domain. But as software developer, I'm not sure if this would help me. But I guess it depends, who reads this. And of course it heavily depends who is the facilitator of the method. This board was not done by a trained (Event Storming) facilitator, hence it looks nothing what it would look like when Alberto would have done it. But at least it gives an impression what it would look like, and what it takes to use this method.
Domain Story Telling
This technique I also found trough a video, also in 2020. In a german IT magazine heise.de "https://www.golem.de/" there is an article series from Eberhard Wolff, who runs a webpage on which he explores different facets of Agile, Software, Architecture, aso ... And he releases his talks, mostly in German, with Experts als on his Youtube Channel
In this video he talked about Domain Story Telling with two architects who are using this method to explore domains with story telling. And they created an open source tool "Domain Story Modeler" based on the open source project "bpmn.io" from Camunda which is also available on their github page.
Since I liked the visual style and the tool. I tried it and I use it off and on since I saw the video and read about the method and tool.
Back to topic, so I used this method to model the above system, too. Here is the result:
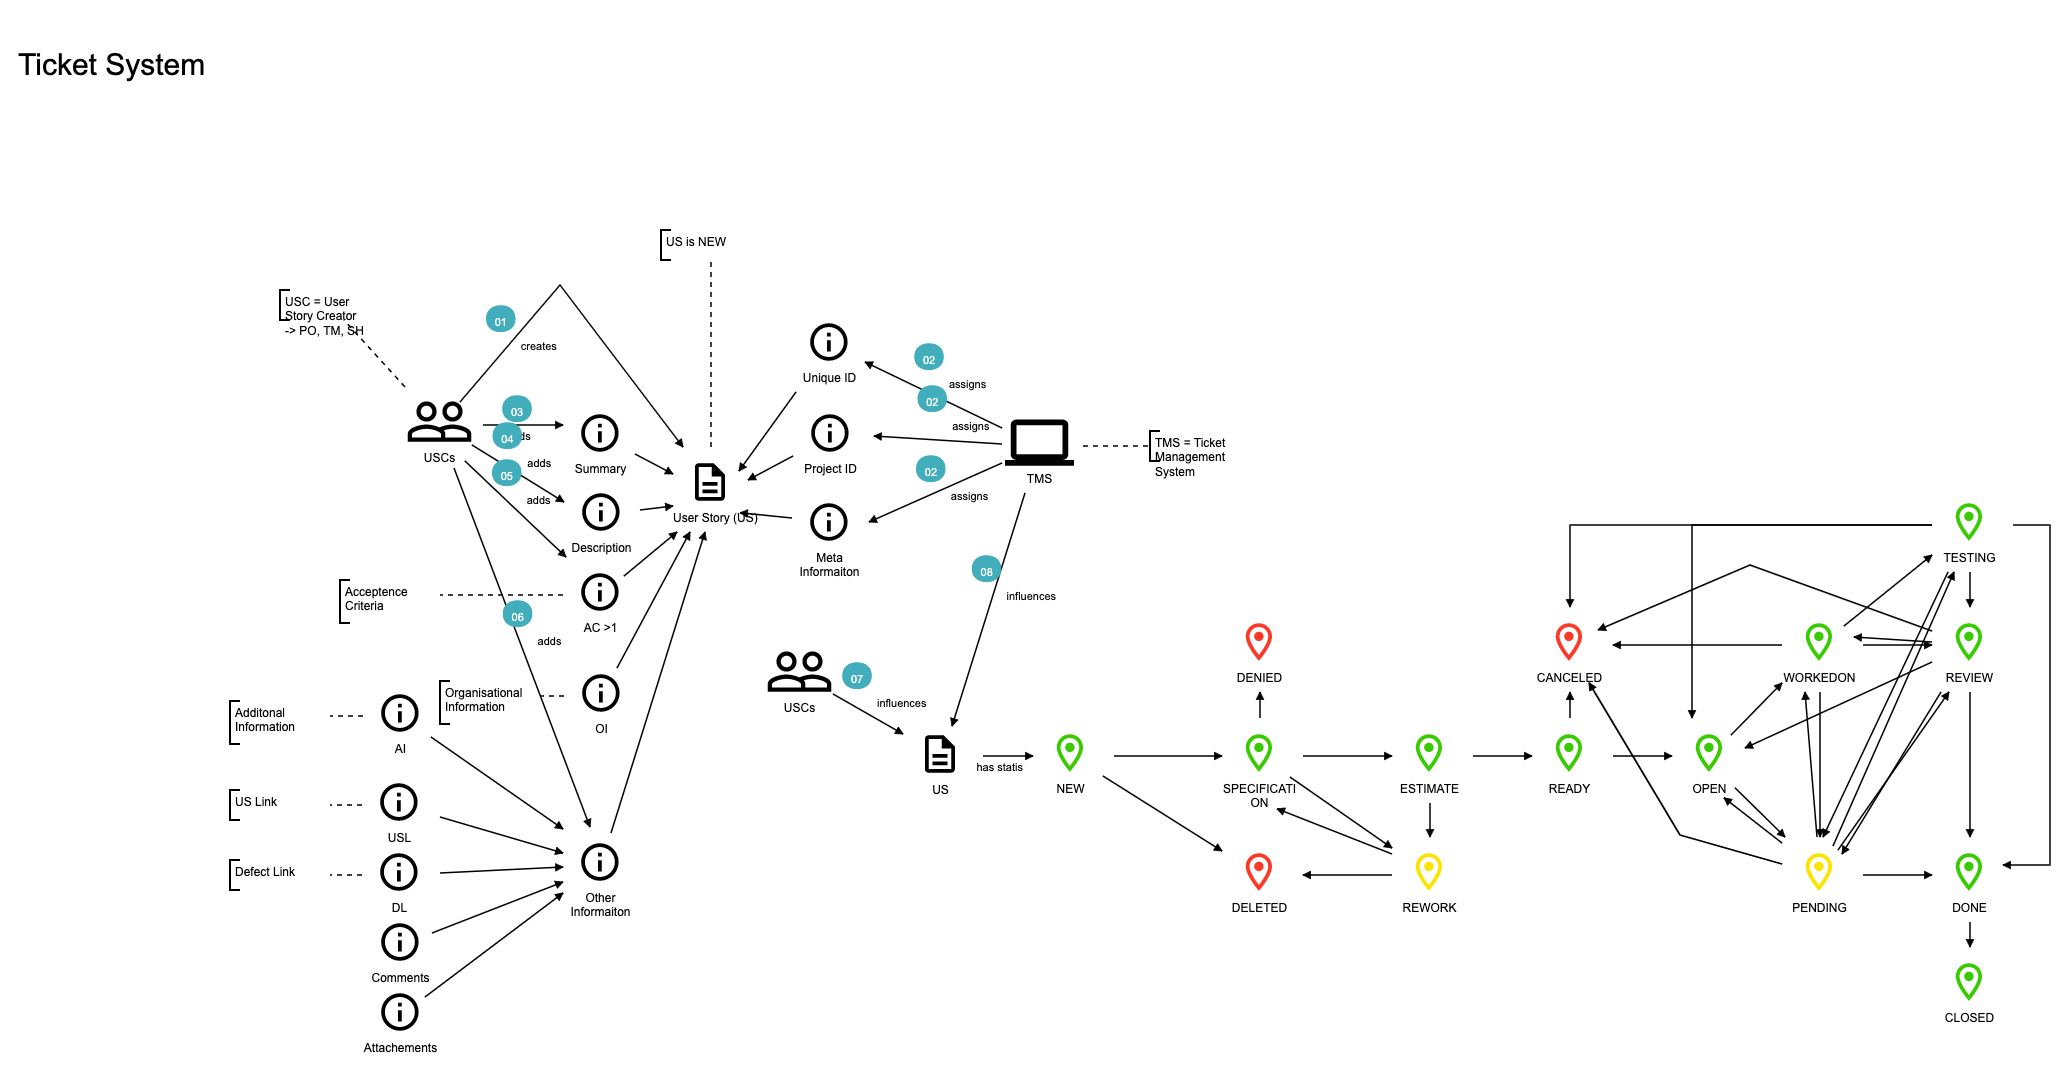
Well, IMHO it transports the information very well. You can identify, roles, data, flow and all the stuff to understand the domain. And with the feature to replay the creation of the diagram, you even have the change to describe the story as it unfoleds.
Concept Maps
Last but not least, Concept Maps. It is a visualization technique which is in IT relatively old. But I assume that it has exited long before. Basically since mankind learned to draw circles and arrows and tried to express concepts with them.
Think about treasure maps. They are concept maps, too.
 You are here, you go there, you find treasure there. And most of the time it was drawn as circles and arrows on maps. And there are even a good method built on it called "DrawToast", have a look or watch the TED video about it.
So creating a Concept Map is not very complex. You draw ellipses or circles, name them with object if needed, join them with arrows, named with actions, if needed and you're done.
The tool I used to create the below Concept Map, is an experiment I did a few years back. It combines p5 and the network component of VisJS.org with some regex parsing of sentences, which then are drawn as a concept map.
And here is the result:
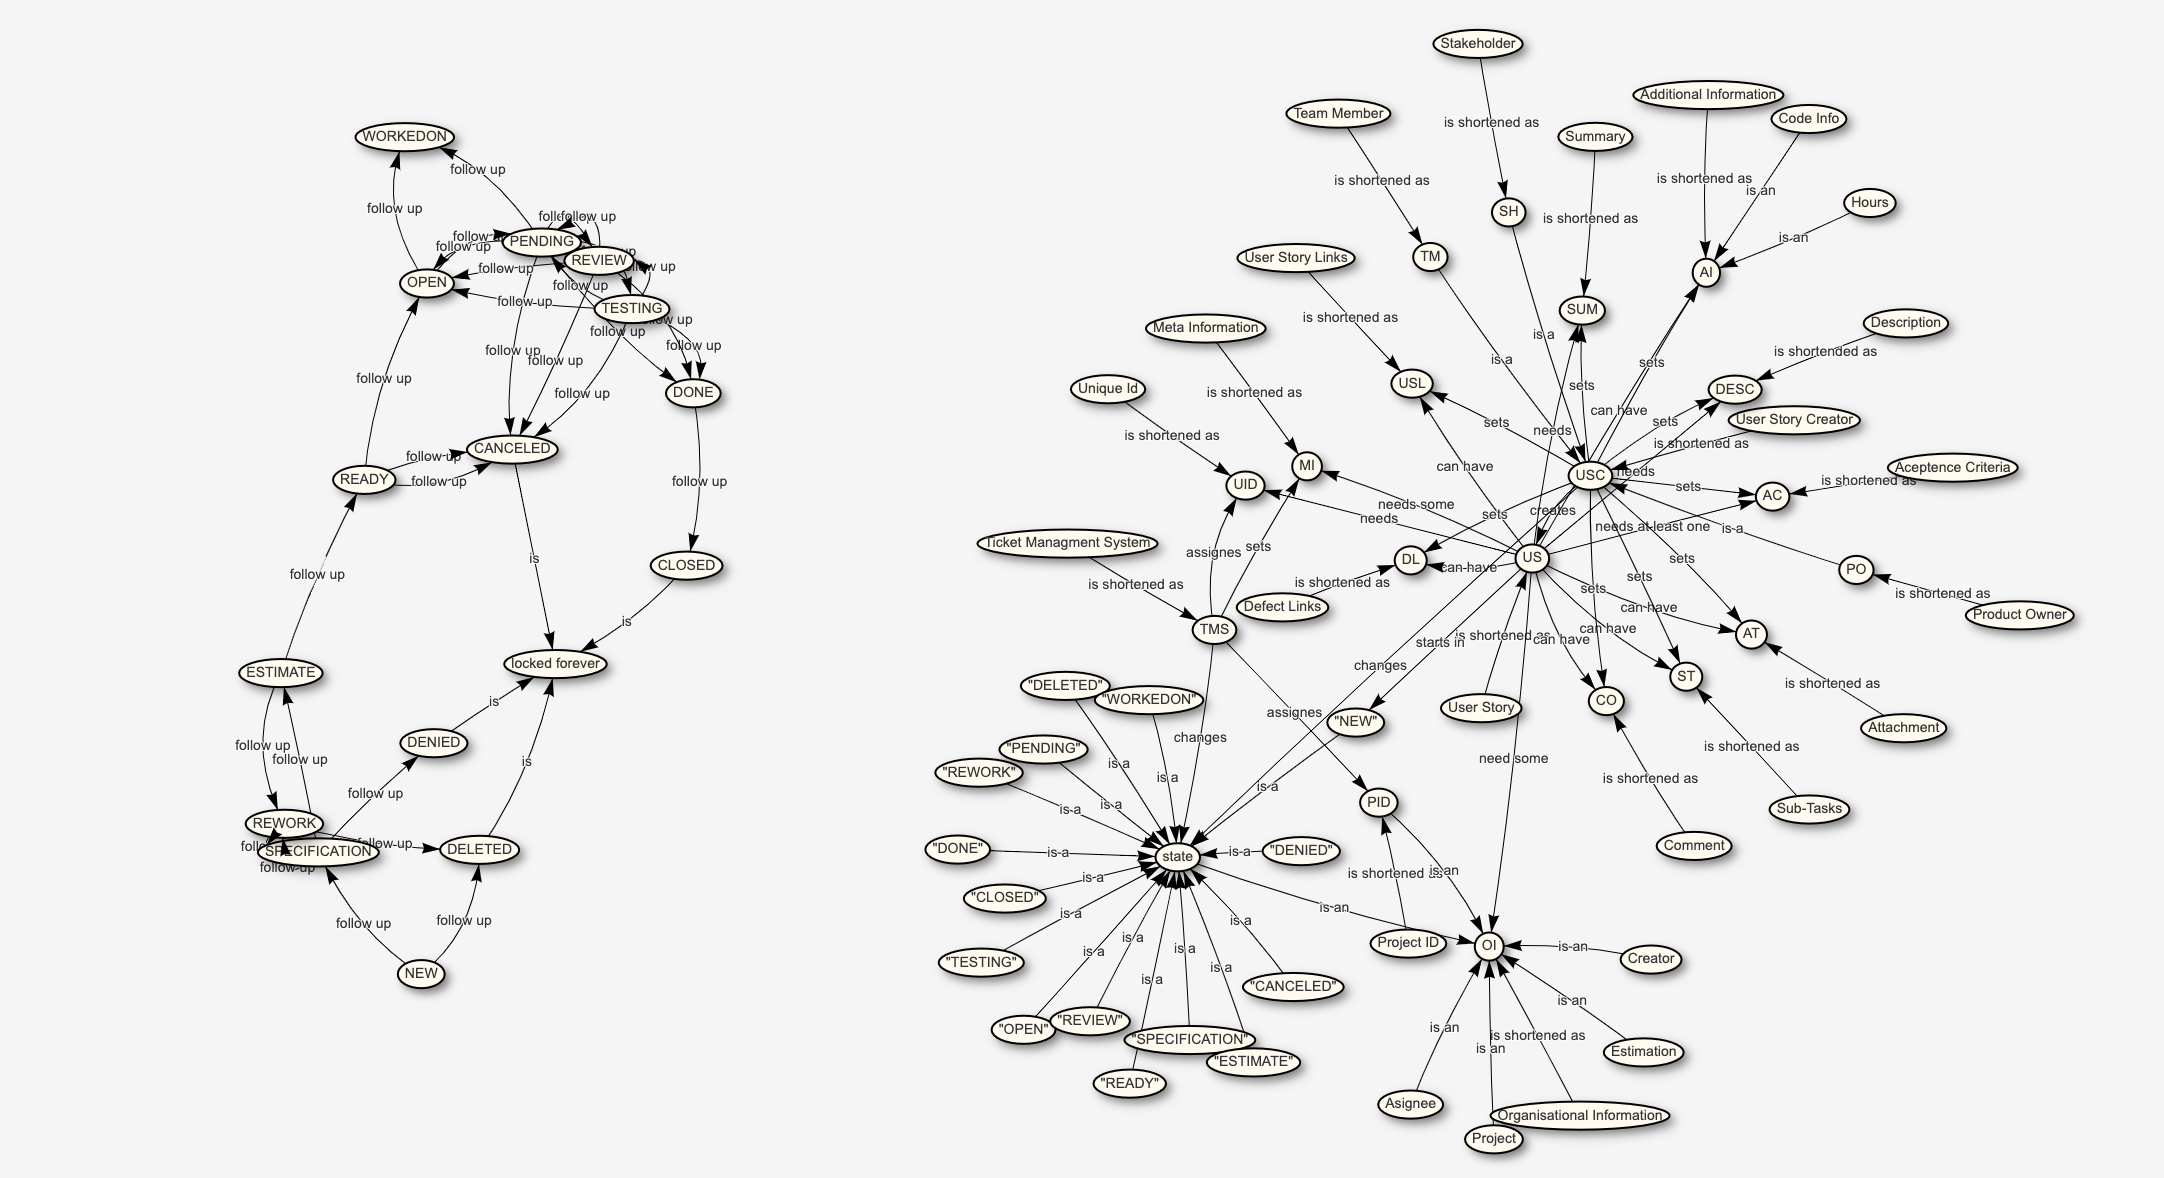
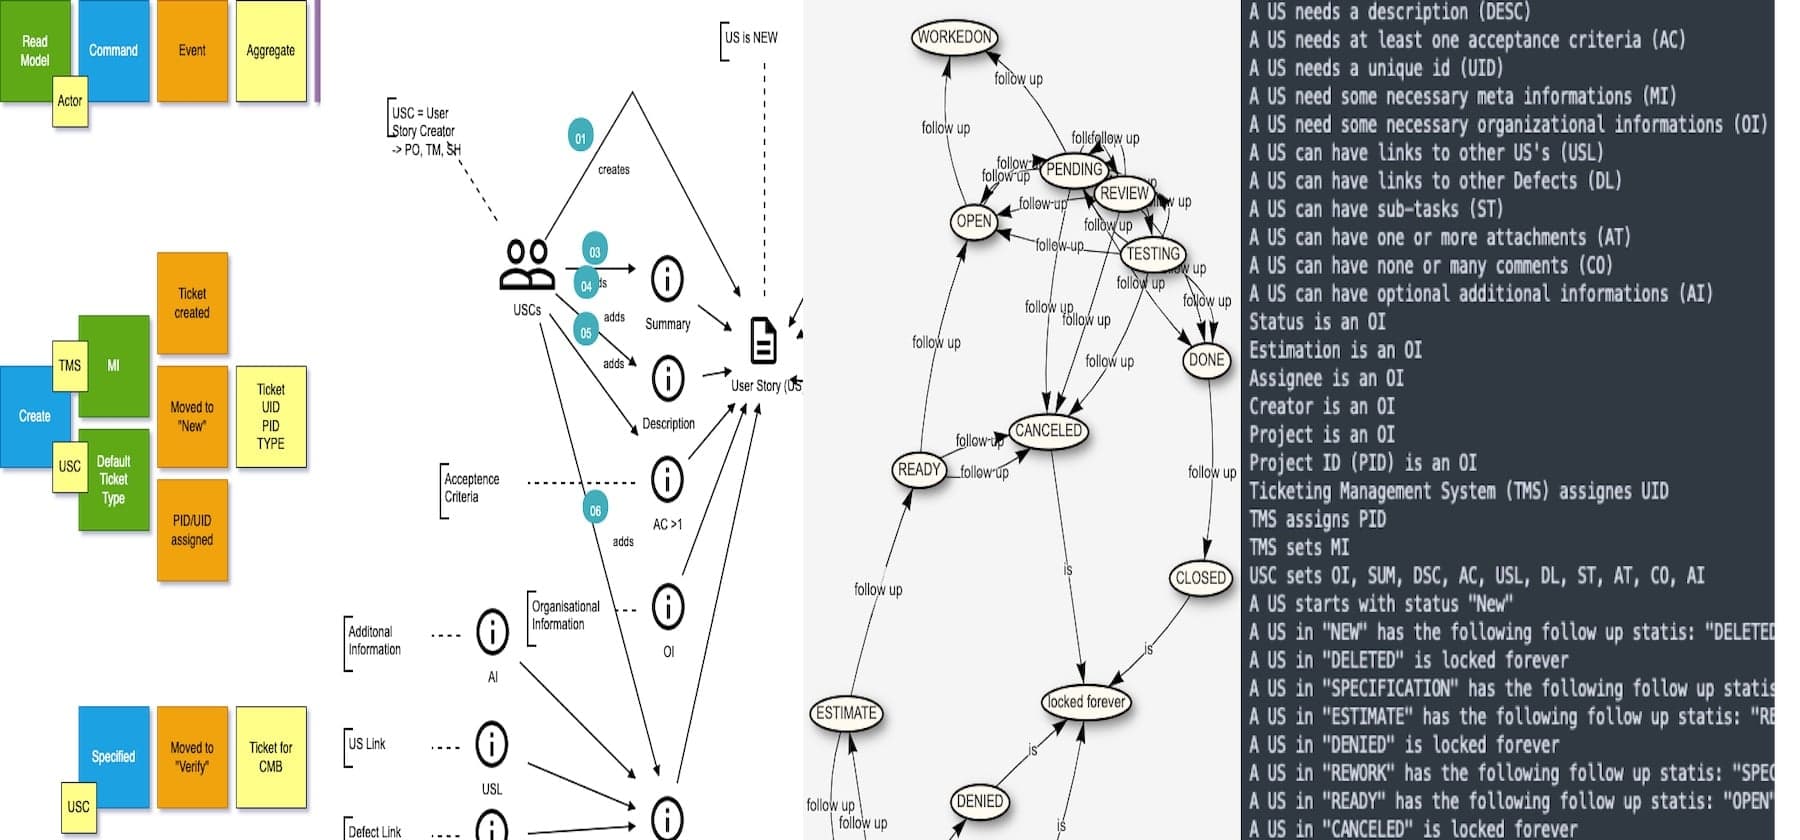
Since it is very small, here are some zooms.
For me personally this is always a good fallback if I want to visualize something complex. Cause I can SEE dependencies, I can SEE where is complexity, I can SEE where is loose or tight coupling. It helps identify problems easily. And I can use it not only for software development, I also used it for understanding processes, organizational structures, workflows and other stuff. It is a versatile method IMHO.
Conclusion
So there are some very interesting agile techniques out there, which can help you to understand your Problem Domain, better. Many are easy to understand and use. Some need more facilitating and guidance, then others, but in the end they all should help you solve a problem. Understanding your Problem Domain and bring everyone to talk about their understanding and their problems in the Domain they all work in.
I will stick most of the time to SSD and Concept Maps, but if I see an opportunity to apply Event Storming or Domain Story Telling, I definitively will use them all. And I hope one day I get the books about those techniques or I can visit a workshop where those methods are thought.
Ok, that's it for this month. As always apply this rule: "Questions, feel free to ask. If you have ideas or find errors, mistakes, problems or other things which bother or enjoy you, use your common sense and be a self-reliant human being."
Have a good one and enjoy the pre-christmas time wherever you are. Alex